How W&B counts logged data
W&B organizes logged data along three dimensions:- Steps: The number of time steps in a run that you finalize by committing logged data. Each step represents a single time index (such as a training step or epoch) and is finalized when you call
wandb.Run.log()withcommit=True, or implicitly whencommitandstepare not specified. - Metrics: The number of distinct metric keys you log (for example,
loss,accuracy, oreval/precision). - Logged points: The total number of metric values recorded, calculated as:
Logging at scale
W&B handles logging across steps, metrics, and total logged points in the following ways at scale:- Steps: Can scale into the millions per run.
- Metrics: For best performance, keep the number of distinct metrics under 100,000 per run.
- Total logged points (steps × metrics): Can scale into the hundreds of millions or more, depending on logging patterns and metric types.
Most performance issues come from logging too many distinct metrics, not from logging too many steps.
Summary of recommended limits
The following table summarizes recommended limits for logging at scale:| Dimension | Guidance at scale |
|---|---|
| Steps per run | Millions of steps per run are common |
| Distinct metrics | Fewer than 100,000 per run |
| Scalars per metric | Fewer than 100,000 values |
| Media per metric | Fewer than 50,000 values |
| Histograms per metric | Fewer than 10,000 values |
| Total logged points | Hundreds of millions or more possible |
Logging limits and considerations
The following sections describe recommended limits for logging experiment data to W&B and how those limits impact performance.Distinct metric count
A distinct metric is a unique metric key logged in a run. Each unique key name counts as one metric, regardless of how often you log it or what values it contains. For example, the following code snippet logs two distinct metrics:accuracy and loss.
Metric names must follow certain naming constraints imposed by GraphQL. See Metric naming constraints for details.
a, b.c, and b.d.
Value width
Limit the size of a single logged value to under 1 MB and the total size of a singlewandb.Run.log() call to under 25 MB. This limit does not apply to wandb.Media types like wandb.Image, wandb.Audio, etc.
Data is saved and tracked even if you log values wider than the recommended amount. However, your plots may load more slowly.
Metric frequency
Pick a logging frequency that is appropriate to your metric. The following recommendations apply per metric key, per run:- Scalars: Fewer than 100,000 logged values per metric
- Media: Fewer than 50,000 logged values per metric
- Histograms: Fewer than 10,000 logged values per metric
wandb.Run.log() calls with commit=False to associate less frequent metrics with an existing step without logging them at every step.
The following example shows how to log different metric types at different frequencies to stay within recommended per-metric limits.
Config size
Limit the total size of your run config to less than 10 MB. Logging config values greater than 10 MB may slow down your project workspaces and runs table operations.Workspace performance
Workspace performance depends on the number of runs, metrics, panels, and files in a project, as well as how they are organized and visualized.Summary of performance factors
The following table summarizes recommended guidance for workspace performance:| Factor | Recommended guidance | Why it matters |
|---|---|---|
| Run count | Fewer than 100,000 runs per project (SaaS Cloud) | Large run sets slow workspace loading and queries |
| Fewer than 10,000 runs (Dedicated or Self-Managed) | ||
| Panel count | Use manual workspaces for large projects | Too many panels increase load and render time |
| Section count | Avoid one section per metric | Hundreds of sections degrade workspace performance |
| Metric count | Use manual mode for 5,000–100,000 metrics per run | Plotting many metrics slows workspace rendering |
| File count | Fewer than 1,000 files per run | Large file lists slow run page loading |
| Visualization type | Use workspaces for analysis, reports for presentation | Workspaces are optimized for high-density analysis |
Run count
To reduce loading times, keep the total number of runs in a single project under:- 100,000 on SaaS Cloud
- 10,000 on Dedicated Cloud or Self-Managed
Panel count
By default, a workspace is automatic, and generates standard panels for each logged key. If a workspace for a large project includes panels for many logged keys, the workspace may be slow to load and use. To improve performance, you can:- Reset the workspace to manual mode, which includes no panels by default.
- Use Quick add to selectively add panels for the logged keys you need to visualize.
Deleting unused panels one at a time has little impact on performance. Instead, reset the workspace and seletively add back only those panels you need.
Section count
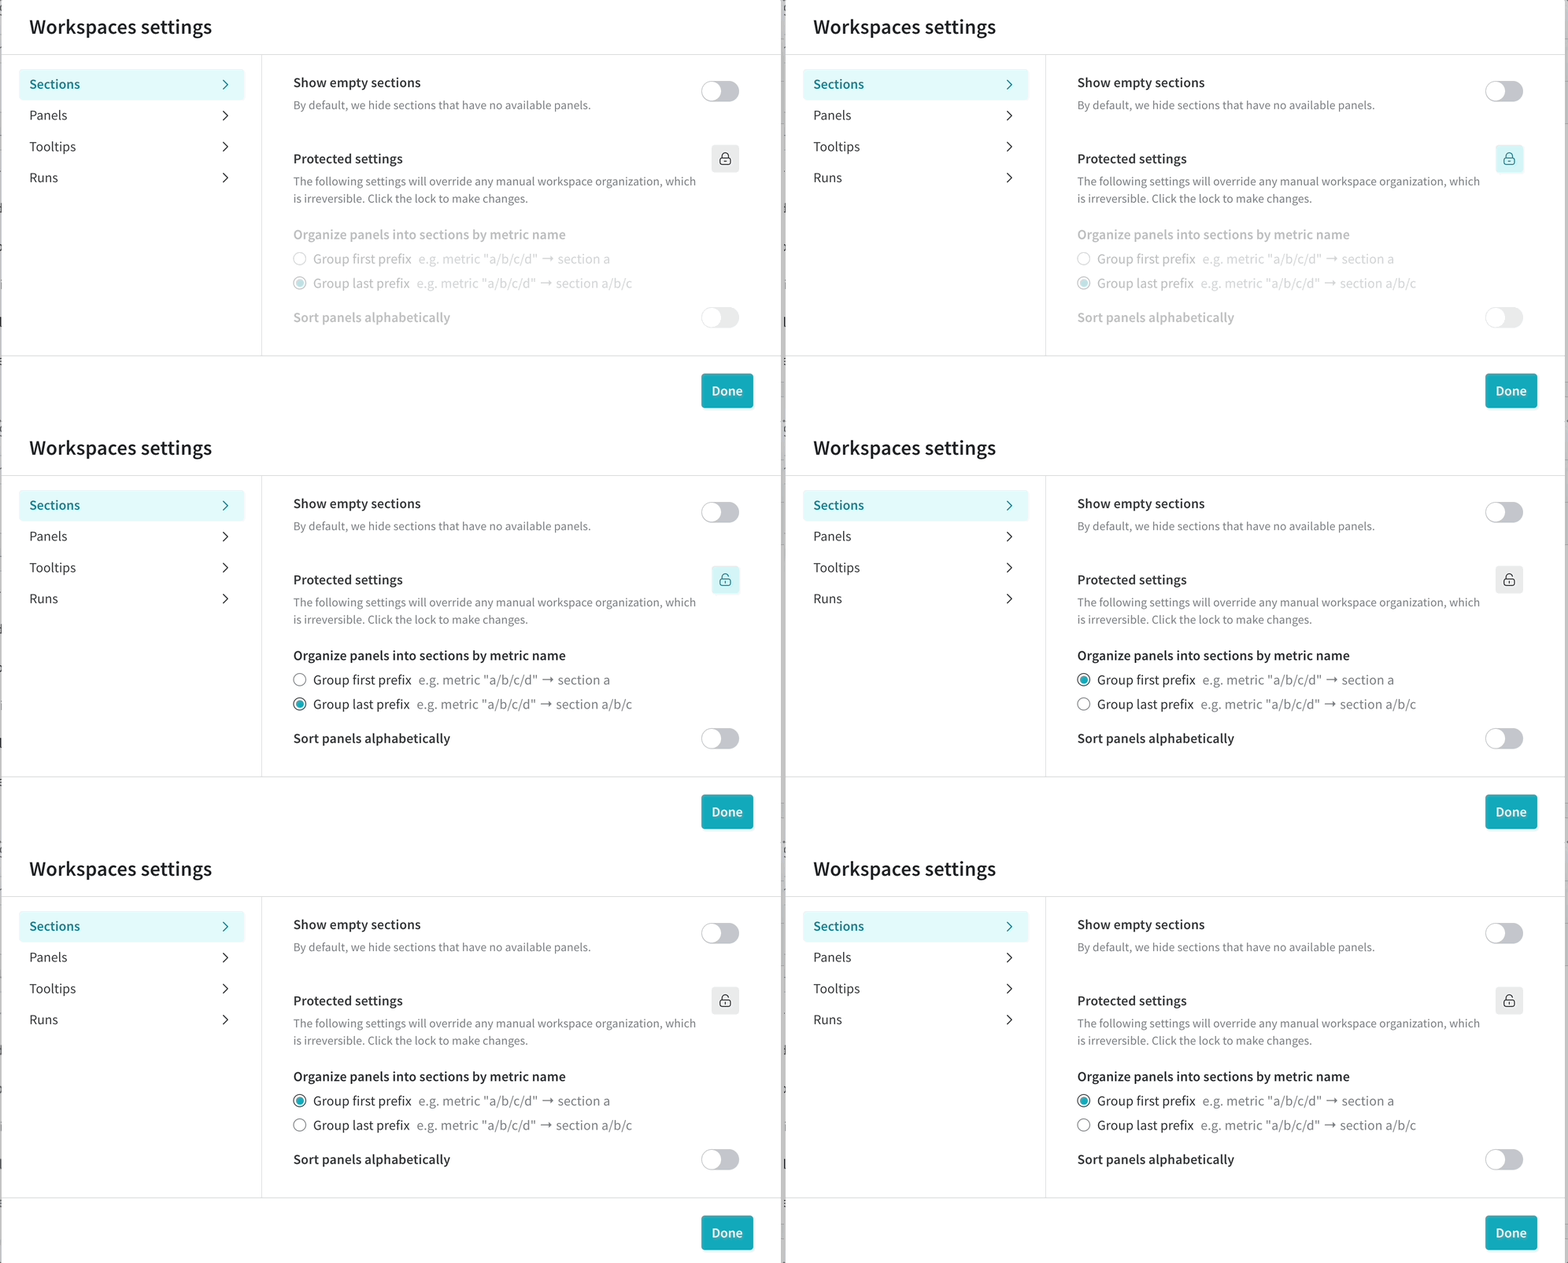
Hundreds of sections in a workspace can impact performance. Consider creating sections based on high-level groupings of metrics and avoiding an anti-pattern of one section for each metric. If you find you have too many sections and performance is slow, consider the workspace setting to create sections by prefix rather than suffix, which can result in fewer sections and better performance.
Metric count
When logging between 5000 and 100,000 metrics per run, W&B recommends using a manual workspace. In Manual mode, you can easily add and remove panels in bulk as you choose to explore different sets of metrics. With a more focused set of plots, the workspace loads faster. Metrics that are not plotted are still collected and stored as usual. To reset a workspace to manual mode, click the workspace’s action... menu, then click Reset workspace. Resetting a workspace has no impact on stored metrics for runs. See workspace panel management.
File count
Keep the total number of files uploaded for a single run under 1,000. You can use W&B Artifacts when you need to log a large number of files. Exceeding 1,000 files in a single run can slow down your run pages.Reports vs. Workspaces
A report is a free-form composition of arbitrary arrangements of panels, text, and media, allowing you to easily share your insights with colleagues. By contrast, a workspace allows high-density and performant analysis of dozens to thousands of metrics across hundreds to hundreds of thousands of runs. Workspaces have optimized caching, querying, and loading capabilities, when compared to reports. Workspaces are recommended for a project that is used primarily for analysis, rather than presentation, or when you need to show 20 or more plots together.Python script performance
There are a few ways that the performance of your python script is reduced:- The size of your data is too large. Large data sizes could introduce a >1 ms overhead to the training loop.
- The speed of your network and how the W&B backend is configured
- If you call
wandb.Run.log()more than a few times per second. This is due to a small latency added to the training loop every timewandb.Run.log()is called.
Is frequent logging slowing your training runs down? Check out this Colab for methods to get better performance by changing your logging strategy.
API rate limits
W&B applies API rate limits on SaaS Cloud to protect system reliability and ensure fair access across shared infrastructure. Rate limits prevent any single user or project from consuming a disproportionate share of resources. W&B returns a429 Rate limit exceeded error along with the relevant HTTP headers when you exceed rate limits.
Depending on your usage patterns, plan, or request type, you may encounter lower rate limits.
Rate limits are subject to change.
Rate limit HTTP headers
The following table describes the HTTP headers returned when a request is rate limited:| Header name | Description |
|---|---|
| RateLimit-Limit | The amount of quota available per time window, scaled in the range of 0 to 1000 |
| RateLimit-Remaining | The amount of quota in the current rate limit window, scaled in the range of 0 and 1000 |
| RateLimit-Reset | The number of seconds until the current quota resets |
Metric logging API rate limits
W&B enforces rate limits in a rolling time window when you log metrics using the W&B Python SDK. Rate limits apply to both online logging (usingwandb.init() and wandb.Run.log()) and offline syncing (using the wandb sync CLI command). Limits apply to both:
- The total size of logged requests
- The request rate (number of requests per unit time)
Suggestions for staying under the metrics logging API rate limit
Exceeding the rate limit may delayrun.finish() until the rate limit resets. To avoid this, consider the following strategies:
- Update your W&B Python SDK version: Use the latest version of the SDK, which includes improvements for request batching, retries, and quota usage.
-
Reduce metric logging frequency: Log metrics less frequently to conserve quota. For example, log metrics every five epochs instead of every epoch:
-
Use manual syncing: W&B stores your run data locally if you hit a rate limit. You can sync your data with the command
wandb sync <run-file-path>. For more details, see thewandb syncreference.
GraphQL API rate limits
The W&B App and Public API make GraphQL to query and modify data. W&B enforces rate limits for GraphQL requests on SaaS Cloud to protect backend performance. W&B applies different rate limits based on the type of request:- Unauthorized requests: Limited per IP address
- Authorized requests: Limited per user
- Project-scoped SDK requests (such as reports, runs, or artifacts): Limited per project based on database query time
Suggestions for staying under the GraphQL API rate limit
Wait at least one second between requests if you fetch large volumes of data using the W&B Public API. If you receive an HTTP429 error or see RateLimit-Remaining=0 in the response headers, wait for the number of seconds specified in RateLimit-Reset before retrying the request.
Browser considerations
The W&B app can be memory-intensive and performs best in Chrome. Depending on your computer’s memory, having W&B active in 3+ tabs at once can cause performance to degrade. If you encounter unexpectedly slow performance, consider closing other tabs or applications.Reporting performance issues to W&B
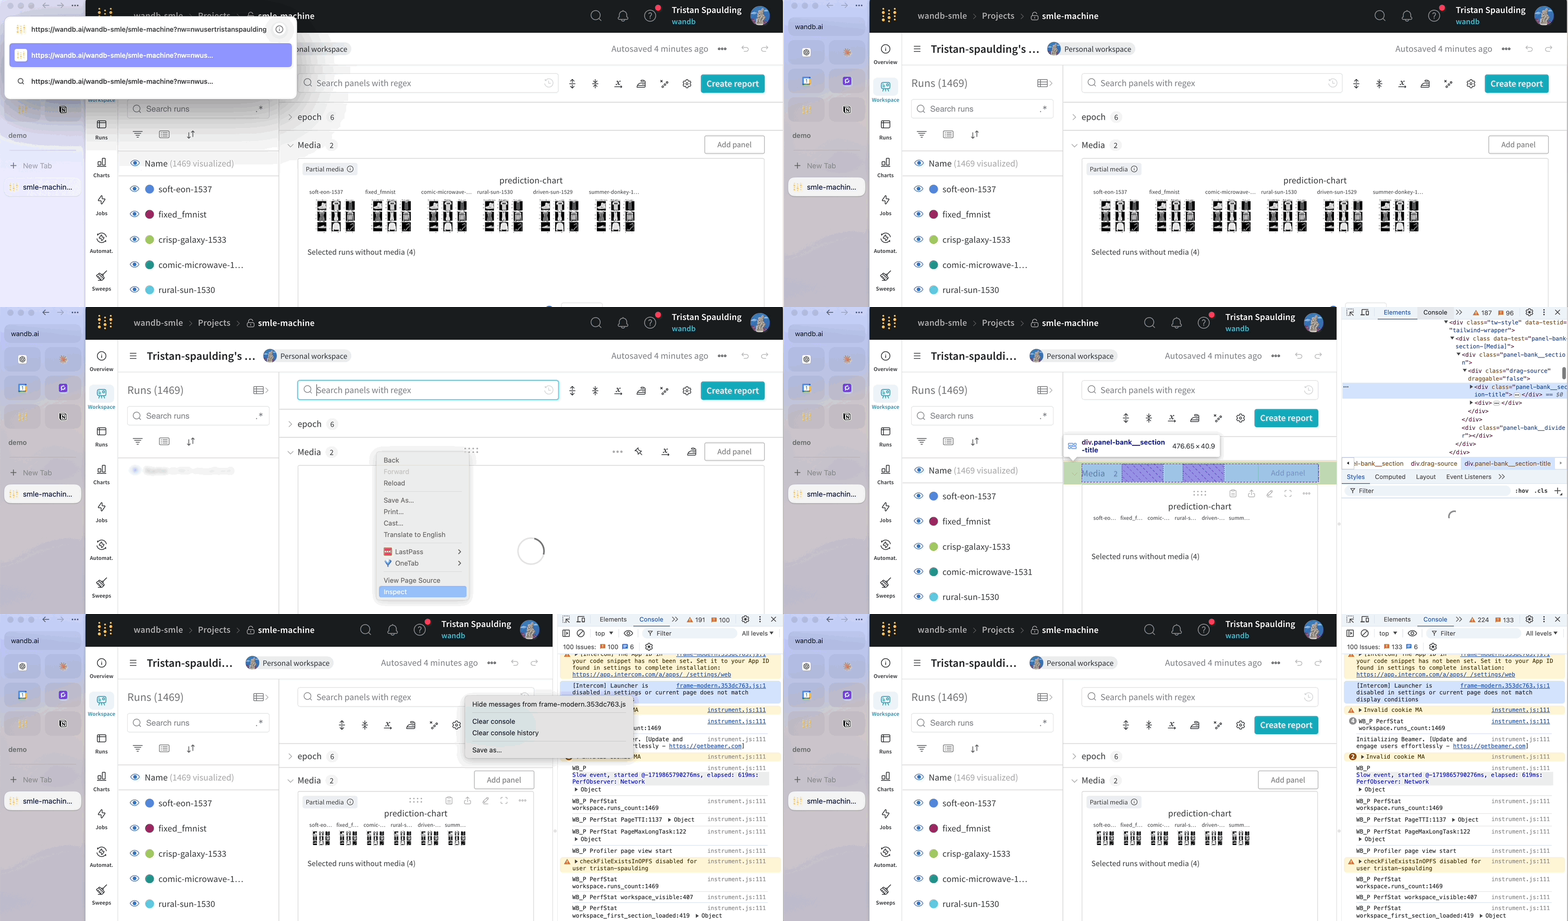
W&B takes performance seriously and investigates every report of lag. To expedite investigation, when reporting slow loading times consider invoking W&B’s built-in performance logger that captures key metrics and performance events. Append the URL parameter&PERF_LOGGING to a page that is loading slowly, then share the output of your console with your account team or Support.
